Bonkers Oil
When our market relentlessly trends, there tends to be one overwhelming driving force behind the rally or sell-off. The present move up is unequivocally led by scarce supply and actual inventory decline. The leaders swap places every now and again (now WTI is the bellwether and Heat is the laggard albeit the latter is trying to make amends) but the direction of travel is unquestionable. Yesterday’s US oil stock data reinforced the underlying sentiment.
Crude oil inventories recorded their 12th decline in 15 weeks and the deficit to the 5-year average has widened to 4.5% from 0.5% in the middle of July. Although products stocks increased despite forecast declines, reductions in run rates are an ominous sign of what to expect in coming weeks as the maintenance period gets under way. Total commercial stockpiles drew and it looks as though the ”other products” category started its seasonal withdrawals, which will go a long way to deplete industrial inventories in coming months. Proxy oil demand is seen resilient above 20 mbpd.
The uncompromising ascent is all the more impressive considering the grim economic backdrop. The dollar, one of the safest havens in times of hardship, is as stubborn as oil – it is untamed. Equities are struggling to gain traction because borrowing costs are now expected to remain persistently elevated, thus bond yields are moving higher. The 10-year bond yield is the highest for 16 years. The looming US government shutdown further fuels pessimism. Chinese industrial profits fell 12% in the January-August period this year. Friday’s euro zone inflation reading, and the release of the US PCE index might just confirm that the “high-for-longer” mantra is actually more than just a worst-case scenario. One, therefore, can only wonder how long the oil price rally will continue unabated – and she will conclude that it will be only as long as the current output constraints remain in place.
|
GMT +1 |
Country |
Today’s data |
Expectation |
|
13.00 |
Germany |
Inflation Rate YoY Preliminary Sep. |
4.6% |
|
13.30 |
US |
GDP Growth Rate QoQ Final 2Q |
2.1% |
Re-claiming Top Spot
The recent performance of the two major crude oil futures contracts, WTI and Brent, conspicuously highlights the impact the collective 1.3 mbpd Saudi/Russian production/export constraints have on the global oil balance and investor’s sentiment. Or it is perhaps more accurate to say that the amount of oil being taken off the market is much more than the above-mentioned 1.3 mbpd if the August 2023 output levels are compared to those in September 2022. Saudi Arabia’s production was just over 11 mbpd back then versus the latest estimate of 8.9 mbpd. Russia’s current output of around 9.5 mbpd is around 300,000 lower than last September. The OPEC+ alliance supplied 44.6 mbpd of crude oil in the last quarter of 2022 (IEA data) and is forecast to pump 42.9 mbpd at the end of the current year.
The anticipated supply deficit supports crude oil prices. Ever since the extension of the voluntary reductions was announced in June WTI and Brent have advanced $27/bbl and $25/bbl respectively. Additionally, as an unmistakable sign of tightness the structure of both benchmarks has strengthened considerably. The M1/M7 WTI spread has gone from parity to above $10/bbl. Its European peer has almost matched this feat as it settled just under $9/bbl yesterday.
In the past three months the discount WTI displays to Brent has also narrowed implying that the US crude oil marker is getting a stronger boost than Brent. And it does that for several sound fundamental reasons.
Firstly, as pointed out in yesterday’s note, oil inventories in Cushing, Oklahoma, the NYMEX delivery point, are worryingly depleted. It was substantiated in yesterday’s EIA stats. At 22 million bbls they are the lowest since July last year and are 14 million bbls under the 5-year average. The operational capacity is around 18 million bbls. It is uncomfortable to entertain the idea of what could happen to the price if WTI open interest at the next expiry, which is still three weeks away, remains higher than Cushing inventories. Nationwide crude oil stocks are also low by historical standards as they display a deficit of 19 million bbls to the seasonal norm.
The US shale sector has been the heartbeat of domestic production growth in the past 8-10 years and there are red flags being raised on that front from the EIA. For the third successive month the agency foresees declining shale output. The peak for the year was seen in July at 9.48 mbpd. Output is predicted to retreat to 9.39 mbpd next month. Recovery is not imminent if the CEOs of Occidental and Devon Energy are to be believed. Both made it abundantly clear that increasing production is not something that is being currently contemplated despite rising prices.
Peaking shale output should not come as a surprise. US rig counts have been implying plateauing production for some time now. The weekly Baker-Hughes data released every Friday evening has been showing a continuous and reliable decline in in the number of rigs that has fallen from 622 at the end of 2022 to 507 last week.
Rising US crude oil exports is another ingredient of the bullish WTI cocktail. Last week 4 mbpd of domestic crude left US shores and the annual weekly average currently stands at 4.1 mbpd, 500,000 bpd above last year’s average and 1 mbpd higher than in 2021. Whilst US crude is predominantly light and sweet, in the absence of available Saudi and Russian barrels refiners in Europe and elsewhere are forced to refine US grades. Of course, the inclusion of WTI Midland in the North Sea Brent basket is an additional boost for the US crude oil segment. According to Kpler, Europe was the destination of 1.34 mbpd of WTI Midland in July whilst the average combined output from the North Sea components that underpin the Brent basket was a meagre 655,000 bpd. The main US export grade has also taken a leading role of setting the price of dated Brent since it is frequently the cheapest one in the mix.
When the fundamental backdrop is auspicious, money managers jump on the gravy train. Net speculative length (NSL) in WTI has increased by 163 million bbls since the middle of June. During the same period Brent NSL has risen by a scant 32 million bbls meaning that the US marker now weighs more in the crude oil equation than Brent. Based on recent developments described above its growing relevance will plausibly be maintained in the foreseeable future.
Overnight Pricing
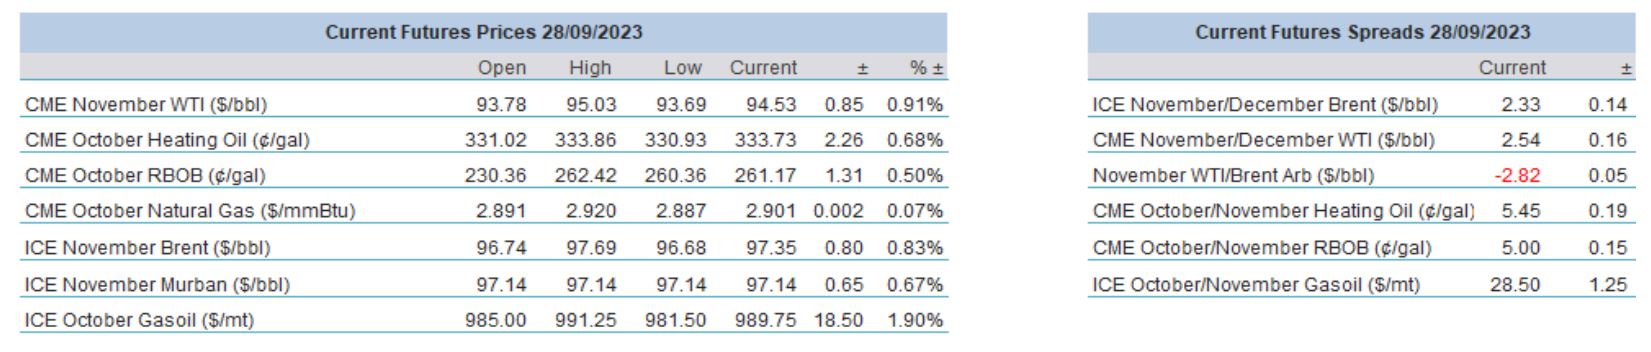
28 Sep 2023
