Focusing on $80
Following last week’s rate cut by the Federal Reserve yesterday was the turn of the Chinese central bank to reassure markets that it is doing whatever it takes to revive its economy. In the broadest stimulus measure since the pandemic, it announced a reduction in borrowing costs on mortgages of up to $5.3 trillion, together with alleviating restrictions on second home purchases, lowering repurchase rates and banks’ reserve ratio requirements. The gut reaction was a 4% rally in Chinese equities with an additional 1% climb registered this morning. The medium-term impacts, particularly consumer spending, will be closely scrutinized. In the US, the unexpected decline in this month’s consumer confidence might incentivize the Federal Reserve to reduce borrowing costs by another 0.5% in November if the health of the labour market deteriorates and inflation remains stable.
The PBOC’s monetary easing helped risk assets, amongst which oil advanced. WTI gained $1.19/bbl and Brent jumped $1.27/bbl. The collective punishment of the Palestine people for the abhorrent terror attack by Hamas on Israeli civilians almost a year ago claims more and more lives by the day and the prospects of truce or even peace talks remain grim at this stage. Although the youngest member of the US tempest family, Helene seems merciful to the USGC, her elder sister, Francine, clearly left her mark on the region. The API reported a draw of 4.34 million bbls in US crude oil stocks. Gasoline and distillate stockpiles plunged by 3.44 and 1.12 million bbls. The alignment of supportive factors, such as brighter economic perspectives, geopolitics and Mother Nature, increases appetite for risk and oil is slowly but resolutely edging towards what is considered the top end of the trading range.
A Change in Approach
The inverse relationship between OECD commercial oil inventories and oil prices in the past was perceptible. They showed a convincing negative correlation, particularly when seasonality is accounted for. This reverse correlation never went below -90% when comparing OECD stock changes with price movements on a quarterly basis in the past 15 years. Yet lately, ambiguity surrounds this relationship, and faith in it is waning. It should not come as a complete surprise since foretelling future oil supply or demand is akin to diving into the unknown given precariousness around the speed and extent of the transition from fossil fuel to renewable energy. It is this unpredictability that is the source of friction between the IEA and OPEC regarding demand estimates in the coming years and decades.
OPEC is much more upbeat on the future of oil than the IEA. Consequently, it sees significantly lower OECD oil inventories for the remainder of 2024 and the whole of 2025 (and possibly beyond) than the energy watchdog of the Western world. Suppose that 40% of the global stock change occurs in OECD countries - inventories should plunge well below 2.5 billion bbls by the end of 2025, by far the lowest since 2007, when our record starts. Under this scenario, oil prices, based on the relationship described above, should break well above $100/bbl, something the market disagrees with judging by the forward curve. The IEA is the polar opposite and using the same methodology on their numbers one would find stockpiles in the developed part of the world flirting with the 3 billion bbls threshold by December 2025. The last time they approached this level was in 4Q 2015 with WTI plummeting to $30/bbl.
Forecasting oil balance is characterized by extreme assessments and to smooth out unprecedently diverging views a fresh approach is needed. One of the reasons why oil fails to challenge former peaks is OPEC’s spare capacity since in case of unplanned supply disruptions it is something to fall back on. Consequently, it needs to be part of the calculus.
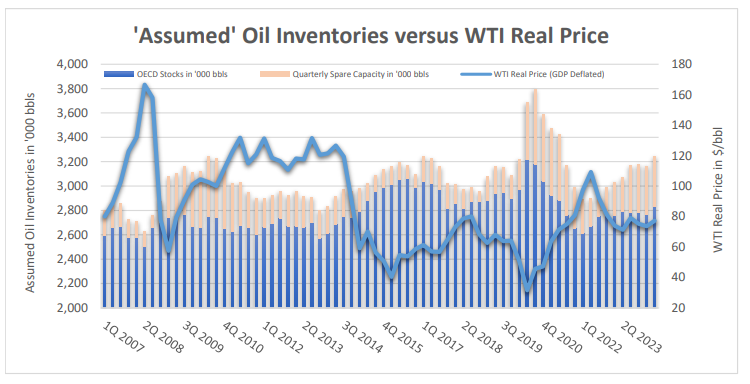
This equivocal backdrop upends the OECD inventory-oil price connection. The unforeseeable impact of the deviating approaches can be greatly mitigated when OECD stocks are observed together with OPEC’s spare capacity as estimated by the EIA and extrapolated to every quarter. If OPEC produces at full capacity an ‘assumed’ OECD inventory level can approximated. Admittedly, under the hypothetical scenario of OPEC pumping as hard as they can, not all their production would go into OECD stocks, nonetheless, assessing global oil inventories, due to lack of transparency, can be vastly misleading.
The reasoning for including spare capacity stands on firm legs as any cuts in the groups output level would presumably result in depleting stocks, all other things unchanged. This, in itself, is an inaccurate bullish conclusion since at the same time spare capacity would grow, something that needs to be accounted for. In other words, ‘assumed’ stocks would remain unchanged and they would only move higher or lower if global consumption shifts or non-DoC supply changes meaningfully. This approach is visualized in the chart, which can be accessed by opening the attachment. It displays a presently moderately high ‘assumed’ inventories, which implies limited upside potential and shows a negative relationship to the price of WTI. OPEC’s room for manoeuvre is severely restricted because the group’s spare production capacity has become an integral part of the oil equation making OPEC/OPEC+ output category almost a zero-sum exercise – rising production entails thinner supply cushion and vice versa. Prices, instead, will probably react more immensely to changes in non-OPEC+ supply and more significantly, to fluctuations in consumption patterns.
Overnight Pricing
25 Sep 2024


