Growing Supply Concerns
It is almost an axiomatic fact that when oil and equities diverge, the former is usually driven by supply considerations. This discrepancy was blatantly obvious yesterday. Equities gained further ground, scaling highs not seen before, seemingly unbothered by the dysfunction of the US government. The logic goes as follows: in the absence of government data, on which investors usually rely, private reports gain relevance. As the planned nonfarm payroll figures are unlikely to be published today, the importance of Wednesday’s ADP employment report increased. It showed an unexpected decline in available jobs in September. Another report indicated that hiring plans last month were the lowest since 2009. Consequently, bets on two Fed rate cuts this year have intensified. When money is cheap, the economy gets a boost, hence the unstoppable stock market rally, also aided by the immortal tech sector.
Oil market participants, on the other hand, must contend with an increasing volume of supply. After the resumption of Kurdish oil exports via Turkey earlier this week, flows are running at 180,000 bpd. Reuters estimates, based on shipping data, that Venezuelan oil exports averaged 1.09 mbpd in September, the highest in almost six years. OPEC+ is widely expected to raise production at its weekend meeting; only the scale remains in question. Analysts polled by Reuters estimated that the OPEC group increased output by 330,000 bpd last month. Between 6 million and 12 million barrels of unsold Middle Eastern crude are available for November loading, according to Bloomberg, citing traders. Although Ukrainian strikes on Russian energy installations continue, gasoil/distillate stocks have risen in major hubs recently, removing a considerable layer of price support. Looking back at the past four days’ performance, it is tempting to conclude that the long-awaited glut expected to characterise the second half of the year is finally loudly knocking on the doors of our market.
Waning Demand Prospects
According to Niels Bohr, prediction is very difficult, especially about the future. Well, projecting oil prices months or years ahead, statistical evidence suggests, does not have to be an arduous task. You just need to know what global and OECD stock levels will be, and, bang, with great certainty, you can derive a future price. This is because of the reliably strong inverse relationship between these variables: the higher the inventories, the lower the price, and vice versa. And estimating stock levels is not complicated either, right? If demand exceeds supply, the difference must come from stockpiles, leading to falling inventories. In the case of a supply surplus, the excess goes into storage.
The only task left is to accurately forecast both sides of the equation. Predicting supply is more cumbersome and complicated than anticipating consumption. Numerous “known unknowns” force frequent revisions—wars, acts of God, and OPEC+ strategy all add uncertainty. In recent years, analysts and traders have also started factoring spare capacity into their models.
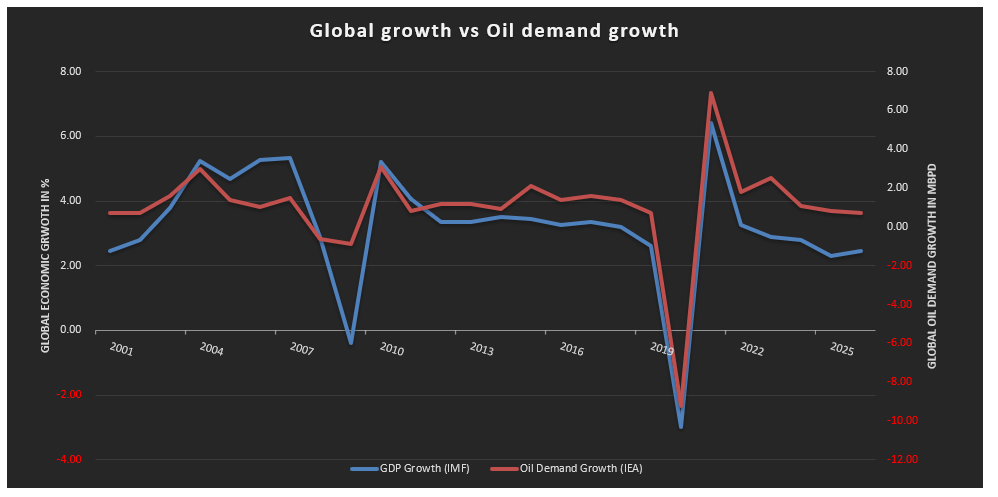
Demand is more straightforward. As the graph below illustrates, global oil consumption largely depends on the pace of economic growth. Curiously, economic growth and absolute oil demand can diverge considerably; however, economic expansion and oil demand growth move in close step. Using IMF data for the former and IEA data for the latter shows that, on an annual basis, this correlation has been nearly 90% so far this millennium. On a side note, this interconnectedness is also evident in the US, but interestingly, does not hold for the other major demand centre, China.
Although past performance does not guarantee future results, it is reasonable to compare economic growth with demand growth to project future oil consumption. Between 2001 and 2024, every 1% annual increase in global GDP required, on average, 600,000 bpd more oil than the previous year. This is a rudimentary approach, and when we exclude the anomalies of the 2007–2008 recession and the 2020 COVID pandemic, followed by a fierce recovery, the figure during calmer times falls to 400,000 bpd.
It is, therefore, prudent, logic would dictate, to add 400,000 bpd of extra demand for every 1% expansion in global economic growth. Yet as reasonable as this sounds, a more nuanced approach is required. Despite the long-term average of 400,000 bpd, recent data imply that each unit of GDP growth now requires less oil than before.
In other words, oil intensity is in decline. Three factors likely explain this: improved vehicle efficiency, meaning less gasoline is needed to travel one mile; the undeniable, though slowing, shift from fossil fuels to renewables; and the structural transition of the global economy, where services increasingly replace manufacturing. Of course, politics can upset this revised approach. Just consider, for example, the fossil fuel–friendly policies of the US administration. Additionally, increasing oil supply, which depresses prices, could delay and discourage the adoption of alternative energy. Still, it is fair to conclude that one unit of GDP growth will require progressively less oil than the 24-year average suggests. For next year, the calculation indicates only 290,000 bpd.
Overnight Pricing

03 Oct 2025
