Ominous Friday
The road back up to $90/bbl is paved with anxiety about inflation. The support that was based on the ever-brewing Israeli-Hamas tension and manifested in the brutal attack on Palestine civilians over the weekend and on the buoyant view on Chinese economic fortunes presented by the IMF was pulled yesterday afternoon as some kind of reality check set in, which sent oil prices $1.50/bbl down from intra-day highs. The pullback by no means is a calamity, it merely serves as an admonition that the current backdrop, both economic and fundamental, would not justify an uninterrupted ascent towards the annual summits.
Tomorrow will prove to be yet another milestone in the perpetual battle against inflation as both May euro zone and US PCE data will be published. The core reading in the common currency area block is forecast to come in at 2.8%, a tad above the April value whilst in the US it is expected to be steady at 2.8%. Anything above these will be greeted with a desertion of risk assets and judging by the recent dollar strength and bond weakness investors are bracing themselves. The afternoon blip can also be taken as a warning sign that whilst the widely anticipated rollover of the OPEC+ output ceiling for 3Q is the only sensible course of action from the alliance to avoid the resumption of the downtrend, without supports from oil demand its impact might well turn out to be muted.
Consumption is projected to pick up in the latter half of the year but the precise timing of it is ambivalent. There is a reason why the Saudis are seen inclined, or better say forced to cut their official selling prices to Asia for July. Morale will be boosted when inventories start drawing, a harbinger of which will be found in the weekly reports on US oil stockpiles. Last night’s API release saw an unexpectedly deep drop in crude oil stocks. Gasoline matched expectations for a small draw but distillates went against estimates and built. Consistent depletion of domestic commercial stocks will indicate that OECD and global stocks are, in fact, sinking, which is impending but not here yet. Until then, only the bold and the trigger-happy would commit herself unreservedly to the upside.
GMT+1 | Country | Today’s data | Expectation |
13.30 | US | GDP Growth Rate 2nd Est (Q1) | 1.3% |
13.30 | US | Initial Jobless Claims (25 May) | 218,000 |
Tentatively growing Appetite from Money Managers
The latest reports on the Commitment of Traders on the two major crude oil futures contracts, both from the CFTC and from ICE, which covers the week ending May 21, provide some interesting reading. In layman’s term the data suggests that the odds of gradually grinding higher are improving and the potential of re-establishing the downtrend is being severely mitigated.
The most intriguing development in the positioning of money managers is the almost unprecedently diverging views on the two crucial crude oil benchmarks. Collective Net Speculative Length (NSL) edged south by 27 million bbls, not an unusual phenomenon and the lowest weekly reading since mid-January. The composition of the weekly change, nonetheless, is jaw dropping. NSL increased by nearly 40 million bbls on WTI week-on-week and was reduced by 67 million bbls on Brent. This is a swing of more than 100 million bbls or 38% of the total crude oil NSL. Although US and Cushing crude oil stocks are not exactly depleting, exports are steadily above 4 mbpd and sometimes are flirting with the 5 mbpd mark. This increasing thirst for US crude oil futures contracts could also herald a nearing rise in physical demand for refined products as the summer driving season approaches. Canada’s 890,000 bpd Trans Mountain pipeline, which started operation earlier this month might have also served as an incentive to add length to the WTI contract. Shedding Brent NSL, on the other hand, is a clear sign of a well-supplied international crude oil market echoed in the recent weakening of the Brent structure and Dated Brent trading at a hefty discount to the forward contracts. During the latest reporting period the WTI/Brent arbitrage got $1/bbl more expensive on the front.
Because of the massive buildup of WTI NSL and the significantly reduced exposure of Brent speculative length the US benchmark has almost as great a weight in the crude oil basket as its European peer – 49%, to be precise, the highest share since last October. The rise of 40 million bbls in WTI NSL was equally split between increasing gross length and cutting gross short positions. Brent is the mirror image of WTI. The fall of 67 million bbls in NSL is the result of liquidating 34 million bbls of long positions and adding 33 million bbls to existing short positions. The combined amount of money invested in the two crude oil futures contracts dipped to $23 billion, the lowest since the beginning of February.
The other curious feature of the latest report is the increased role of short positions in NSL, ie. the long/short ratio. It is low, insinuating that short positions in the NSL are getting overweight. This observation is more fitting to Brent than WTI, which should not come as a surprise given that it was the former, whose NSL plunged last week. Brent’s long/short ratio is 2.2 (267 million bbls of gross longs versus 121 million bbls of gross shorts), which is the lowest weekly value since last December and the second lowest for a year. On the other side of the Atlantic it stood at 2.5, which is not exactly on the high side either but is certainly not outrageously low by historic standard. Yet, one might conclude that gross short positions are comparatively elevated, particularly in Brent suggesting that those who had a bearish view on oil prices might be tempted to cover these positions in case of price-supporting headlines and could be less inclined to add to them on further negative developments. The tentative reversal in sentiment is confirmed by the recent advance in both WTI and Brent prices. This is, of course, not to say that the trend is irrevocably turning but statistical evidence says that the lower the long/short ratio, the more exhausted the downtrend becomes – something that obviously must be backed up by a tangibly improving fundamental outlook.
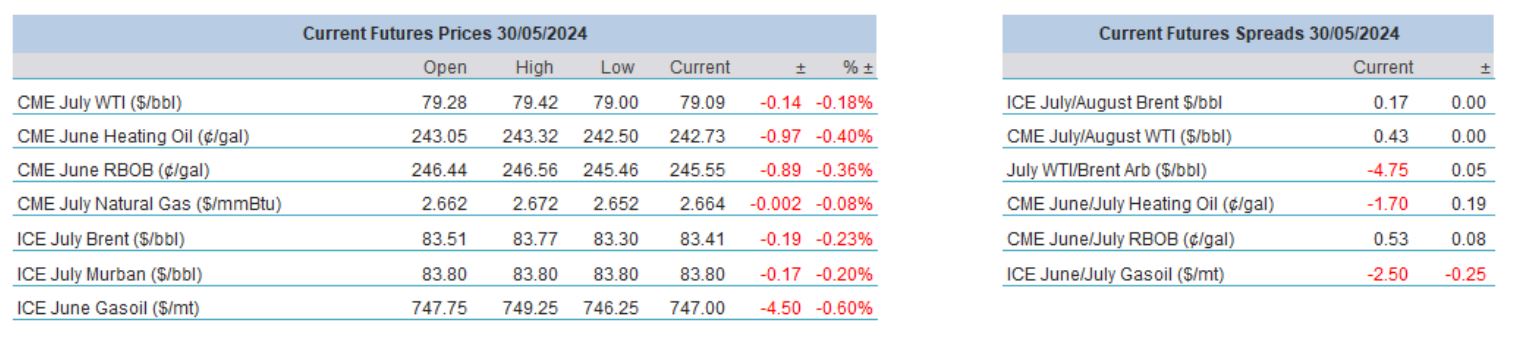
Overnight Pricing
© 2024 PVM Oil Associates Ltd
30 May 2024
