Saudi Move Triggers Temporary Sell-Off
Market equilibrium occurs at the point where the descending demand curve and the ascending supply curve intersect on a graph, the vertical axis of which is price and the horizontal one is quantity. In equilibrium the quantity demanded equals the quantity supplied and this intersection represents the equilibrium price. If the supply curve shifts to the right (ie supply increases) or the demand curve to the left (ie demand decreases) the equilibrium price will fall, which is what happened yesterday after the Saudi announcement of reducing the Kingdom’s February OSP to Asia by $2/bbl. The reason for the decision is a plausible shift of the Asian, and possibly global, oil demand curve to the left – the quantity of oil demanded by refiners from Saudi Arabia will decrease next month.
It will, therefore, not come as a surprise that oil prices were pushed over the precipice with both WTI and Brent trading close to $4/bbl under Friday’s settlement prices at one point before settling $3.04/bbl and $2.64/bbl weaker on the day. The question is whether the Saudi move of reducing OSP to a 27-month low is also a sign of potential increase of oil supply implying serious discord within OPEC+. It will take time to find it out but if this is, in fact the case, the market will find it more than challenging to recover significantly without actual supply disruption from the Middle East. Until then, however, the brewing tension in the Red Sea together with the force majeure declared at Libya’s Sharara oil field and a reasonably positive US inflation data due to be published on Thursday will ensure that the downside will be limited.
Could Geopolitics Support WTI?
The US benchmark used to trade at a premium to Brent. Whilst its quality is not that much different from its European peer its gasoline yield is higher and the unquenchable thirst of US drivers for this motor fuel in the past always provided healthy demand for US crude. Additionally, the US ban on crude oil exports also meant that there was a one-way traffic regarding arbitrage, and it was from Europe to the US – if crude oil economics made it worthwhile.
The premium that was visible up until the financial crisis of 2007-2008 then slowly started to erode and ultimately turned into a discount. The reason for this trend reversal is obvious and well publicized. The emergence of the US shale industry made the world’s biggest oil consumer less reliant on foreign oil and the structural change is conspicuously reflected in the arbitrage value. From 2016 onwards the discount of WTI to Brent has gradually become deeper. In 2016 the front-month WTI futures contract averaged 1.67/bbl under its European counterpart and last year this differential stood at $4.57/bbl.
The increase in US crude oil output is the most salient factor behind the relative weakness of WTI, yet the arbitrage can widely fluctuate. As domestic production grew the export ban on crude oil was lifted at the end of 2015. It then meant that apart from prices, crude oil quality, shipping costs, location, delivery logistics, global supply and demand and geopolitical developments have all started to influence the value of the arbitrage. US refiners are more dependent on crude oil that is somewhat heavier and sourer than the domestic grades therefore gross crude oil imports have remained relatively resilient over the last decade or so (with exports also growing substantially). Around 7.8 mbpd of foreign crude oil arrived at the US in 2013 whilst last year’s weekly average, EIA data suggests, was 6.5 mbpd, which is an annual increase of 200,000 bpd. In those 10 years US crude oil output has increased from 7.5 mbpd to 12.6 mbpd.
As mentioned above, one of the factors that has a profound influence on the value of arbitrage is geopolitics, particularly flare ups in tension close to oil producing regions. No wonder that the current Israeli-Palestine war has had a more tangible bullish impact on Brent. On October 6, the day prior to the Hamas terrorist attack on Israeli civilians, the front-month arbitrage was -$1.79/bbl. Yesterday it settled -$5.35/bbl having been as low as -$6.62/bbl a few weeks ago. WTI has lost a considerable amount of value against Brent because the geographical proximity of the conflict to Europe has had a more noticeable bullish impact on Brent than on WTI. Inter-month spreads imply the same effect. The M1/M7 Brent spread has declined from $5/bbl to $1.3/bbl in the past 3 months, but the plunge was harder on WTI as the backwardation has narrowed from $6.50/bbl to 15 cents/bbl recovering from contango lately.
There is a case to make that this trend will shortly come to an end and maybe this is already what is implied by the above-mentioned recovery in WTI structure. The M1/M7 spread that traded around -$1.2/bbl in the middle of December is now back in backwardation. A quick glance on the map might just support a comparatively upbeat view on WTI. The frequent attacks on commercial vessels in the Red Sea are forcing companies to look for alternative routes and in the absence of a safe passage via the Suez Canal and the Bab al-Mandab Strait rerouting ships to Europe can only happen around the Cape of Good Hope, a voyage that is longer than shipping oil from the USGC to Europe. To carry a cargo of crude oil from Ras Tanura of Saudi Arabia to Northwest Europe around Africa takes twice as long as from Houston to NWE. In this uncertain geopolitical climate in the Middle East and even without explicit supply disruption it could be safer to rely on US crude supporting WTI that sees increasingly solid demand from Europe anyway ever since the introduction of WTI Midland in the Brent basket. It is not inconceivable to expect the US crude marker to start catching up with Brent should hostilities around the Red Sea prove to be a protracted affair and its discount to Brent will narrow meaningfully over 2024.
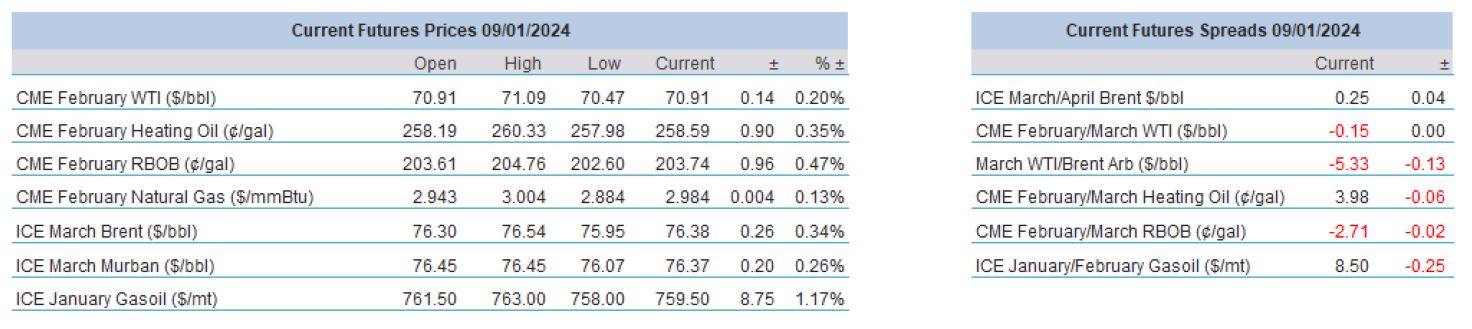
Overnight Pricing
© 2024 PVM Oil Associates Ltd
09 Jan 2024
