Today is All About the US PCE
The standout number again from the EIA inventory report yesterday was the state of crude stocks. They have now increased for 5-straight weeks and although a little more bashful than the API build of 8.4mb, the 4.2mb build ensures that the current lack of refinery runs in the US sees a steady gain in holdings at Cushing, with another 1.46mb build as production in the US remains steady at the record 13.3mbpd. Distillates did indeed draw stock by 510kb, but bulls will be disappointed to see that implied demand yet again fell by 404kbpd which is still some 10.4% below the 5-year average. Gasoline seems the more likely to have any positive effect going forward, the draw of 2.8mb and a small increase in implied demand of 267kbpd can easily be made into a friendly argument when married with the current Russian ban on Gasoline exports that starts as of tomorrow.
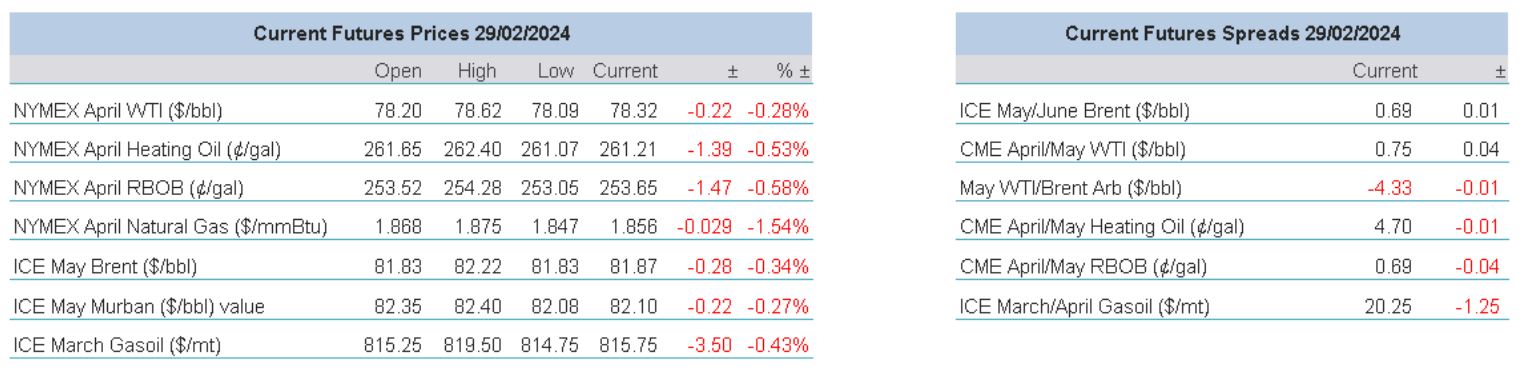
There will be likely strange moves in oil prices today as we see expiries not only in Brent, but also in the US contracts of Heating Oil and RBOB. The extremely stretched backwardation in the front spread of Brent will cause consternation for technicians, but it also has rallying influence on its nearby spread peers, M2/M3 Brent is now trading at $0.73/barrel. However, even such micro issues pale against what might come from the wider macro suite today. Inflation data is due for the largest economies of Europe, Germany and France and as always, jobless claims in the US will be an important data marker. But outshining them all on the data stage is the US Core and PCE Price Index, the favoured standard of the US Fed when assessing inflation. Faced with a flurry of data culminating in the PCE number, global stock markets have behaved in benign fashion for most of the week, therefore if a print outside the remit of the expected PCE year-on-year 2.4% and the Core PCE 2.8%, there will be fireworks from this week’s thus far fettered investment tourists.
GMT | Country | Data | Expectation |
13.00 | DE | CPI MoM, YoY (Feb) | 0.5%, 2.6% |
13.30 | US | Core PCE Price Index YoY, MoM (Jan) | 2.8%, 0.4% |
13.30 | US | PCE Price Index YoY (Jan) | 2.4% |
13.30 | US | Initial and Continuing Jobless Claims | 210k, 1.874m |
Inventory levels are no markers of clarity
Some of the most powerful, notable voices in oil trading, while taking advantage of International Energy Week, took time to air views that are indicative of the current state of oil price stasis and how the many different threads that make up the market’s machinations eventually offers a tapestry that is not only unclear, but open to personal interpretation. “This market does feel relatively tight,” Trafigura’s chief economist, told Bloomberg Television. “You’re hearing the phrase upside risk a lot more than you have in the past couple of years.” Not exactly against, but not exactly in accord was a more cautious stance offered by the CEO of Vitol, noting that crude prices at or around $80/barrel seemed “fairly comfortable” and that the market has absorbed the worst of what Western sanctions on Russia might reflect, leaving prices much less fragile as seen after the start of the Ukraine war.
Even much-watched global inventories are not to be trusted, not that there is any falsehood in them, rather than they also offer occlusion which again chimes with a market lacking trend. Kpler data, as seen on Reuters, shows onshore oil stocks totalling 1.62 billion barrels in OECD members representing the lowest volume in storage for this time of year since 2020. It is worth wondering whether this is caused by the elongation of ship journeys practicing Red Sea avoidance and that storage has transferred elsewhere, possibly to floating rather than land based. Vortexa figures show that from late September, the volume of crude on water has climbed from 1.11 billion barrels to current 1.2 billion, which is the highest amount for 6-months and likely makes good this argument.
However, and something we have touched on before is the cost of storage. It is no coincidence that levels of inventory have come down commensurate with how interest rates have increased and stayed elevated. Financing oil in tank is now an expensive affair and with the mathematics of a contango carry so very far from reality, holding oil is an ephemeral trade and one that is subject to the vagaries of monthly individual crude grade demand and delivery cycles as opposed to long-term strategies involving 6-month and calendar puzzles.
Tracking storage has become akin to tracking oil balances and while there might be signals from OECD countries of longer-term reductions in crude holdings, the short-term builds do not add up to the same diminishing levels. According to Genscape data, Crude storage in the Amsterdam-Rotterdam-Antwerp (ARA) area rose by 5.5% or 2.6mb and with the EIA/DOE data backing up current crude builds by registering +4.2mb thus adding to continued hikes in holdings, even if refineries were able to come screaming back with all runs blazing, product demand is questionable when one considers the state of distillate cracks as seen in M1 Heat/WTI futures falling $14/barrel in 16 days.
Looking at inventory as a way through the quagmire in the current affairs of oil price drivers does not exactly instil confidence. To blame the current narrative of ‘tightness’ as seen in inflated crude backwardations on lack of oil in tank does seem rather premature. If there are small differences of opinion from the great trading houses of our market, if plotting inventory gives no decisive picture, if the oil price progression remains dependent on the Gaza nightmare, and if the central bankers of the world continue to play cat and mouse with interest rate policies, our increasing frustration of being part of a rangebound market will fester.
Overnight Pricing
© 2024 PVM Oil Associates Ltd
29 Feb 2024
