Who Needs an Enemy with a Friend like Him?
The inauguration of the incoming US President is 12 days away, but his belligerent rhetoric is already sending shivers down the spine of foes and allies. During a press conference, Mr Trump re-issued threats from his first term to buy Greenland and he did not rule out seizing the island by using economic or military coercion on Denmark. He also pledged to take control of the Panama Canal citing national security interest. He said that annexing the country’s northern neighbour ‘would really be something’ but it would happen through economic and not military pressure.
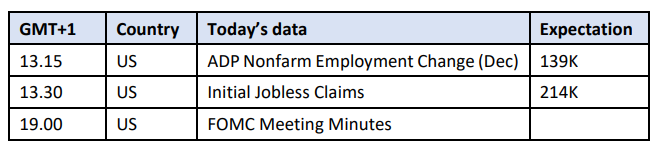
His coercive political and economic plans, the pledged tariffs and protectionist policies justifiably raise investors’ anxiety levels. Fears of re-igniting inflationary pressure sent US equities sharply lower yesterday although he will inherit a solid economy as echoed in yesterday’s data set. The Labor Department said the job opening hastened in November and the US service sector expanded faster than anticipated last month after the index measuring manufacturing activity reached a 9-month summit. Whatever Donald Trump’s real intentions are what is certain in the immediate future is uncertainty.
In our market, the sanguine mood seems to persist as oil prices keep edging higher due to a combination of weather-related support, possible sanctions on Russia and hopes for a revival of Chinese demand. These, however, appear to be short-term factors and they do not alter the view of potential supply surplus this year. Overnight, the release of the first API report of the year showed an unexpectedly large drawdown of 4.02 million bbls in crude oil stock, which was more than compensated by a rise of 7.33 million bbls in gasoline and 3.2 million bbls in distillate inventories.
No relief for Refining Margins
Because of a lack of transparent data on global oil inventories OECD stocks used to be a reliable barometer of the health of the oil market. They were inversely connected to oil prices and the crude oil market structure. The lower oil inventories fell in the developed part of the world the higher prices climbed and the deeper the backwardation of crude oil benchmarks became. This relationship has recently been upended as the market took the view that the spare production capacity of OPEC+ countries, which is around 6-7 mbpd, is more than sufficient to ensure adequate supply in case of unexpected supply disruptions and depleting inventories.
Consequently, attention has shifted towards refining margins or crack spreads to gauge global and regional oil balances. The product/crude oil price differentials have always been reliable price indicators as they display a tight correlation to crude oil prices, but their roles have meaningfully appreciated since the stock/price relationship has deteriorated. Demand for crude oil, the feedstock for refiners, is only boosted if the prospects of healthy end-user consumption of products are bright. This is normally reflected in strong crack spreads.
When looking back at 2024, it is conspicuous that the supply-demand oil balance was anything but tight, at least this is what global refining margins indicate. Their global indicator, published by the IEA every month, shows that the 2023 average was higher in every part of the world than in the January-November period of last year. In some cases, particularly in Europe, the value of different refining margins more than halved. In the US, on the other hand, the year-on-year losses were significantly less. This deviation is also reflected in the performances of the equity markets – Europe’s economy was considerably less buoyant than that of the US.
Whilst the IEA’s monthly publication is a useful tool to form a view on the oil balance, it contains information about the past and as we know, past performance is not indicative of future results. Derivative markets help overcome this conundrum. Both the CME 3-2-1 crack spread, and the ICE Gasoil/Brent spread confirm what the IEA observes. Refining margins weakened in 2024. On the CME the 3-2-1 spread averaged $23/bbl in 2024, down from $32/bbl the year before. On ICE the annual loss stood at $8/bbl; the spread dropped from $28/bbl to $20/bbl.
The curious development is that these values are still high from a historical perspective. Crack spreads received a massive boost in 2022 after Russia invaded Ukraine. The 3-2-1 spread on the CME shot up to $38/bbl whilst the Gasoil crack rallied to $40/bbl on average, as the invasion and the resultant sanctions threw Russian product exports to Europe into doubt. When it became obvious that actual shortage was avoided and only oil flows were re-aligned, crack spreads started to retreat in 2023, something that continued last year. Yet, spread values were still higher than the 2015-2019 average of $18/bbl on the CME and $14/bbl on ICE. (We deliberately omitted the aberration of the pandemic years of 2020 and 2021).
So, the question now is what to expect for this year. What is striking is the projected consumption of transport fuels in the world’s two biggest economies, the US and China. It is now a widely accepted mantra that both gasoline and distillate demand peaked in the US in 2018 – at 9.33 mbpd and 4.15 mbpd, EIA data suggests. The 2025 forecasts are 8.95 mbpd and 3.96 mbpd. In China, the astronomical surge in EV sales has a profound negative impact on gasoline and distillate demand. Several domestic refiners believe that demand for transportation fuel has reached its summit as EV sales are set to eclipse the sale of vehicles with combustion engines in 2025.
These fundamental changes do not bode well for traditional refining margins and are discounted in futures prices. The current 2025 strips imply that further erosion in values is anticipated. The CME 3-2-1 crack is priced around $20/bbl for this year with the Gasoil/Brent crack spread seen around $19/bbl. In other words, regression toward the 2015-2019 mean is very much plausible and any rally in crack spreads triggered by unforeseen circumstances will be met with fierce selling.
Overnight Pricing
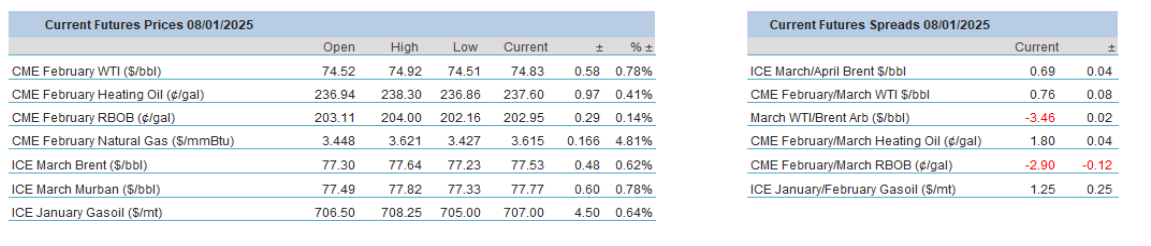
08 Jan 2025
